Home MCQs Cases Flashcards Your Feedback Become a reviewer More student books Student Apps Join an e-mail list Buy/find out more
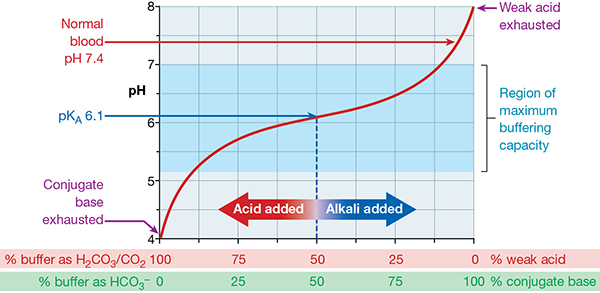
Figure 10d Buffer (titration) curve: Effect of addition of acid or alkali on pH of a bicarbonate buffered solution « Previous Next » Show Labels « Back to contents list Print