Home MCQs Cases Flashcards Your Feedback Become a reviewer More student books Student Apps Join an e-mail list Buy/find out more
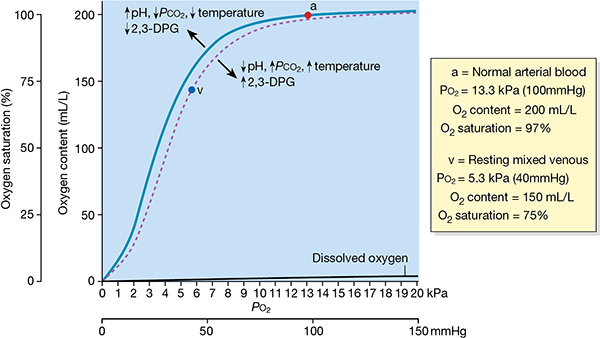
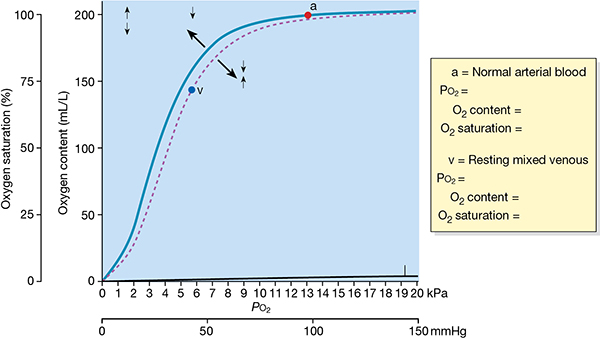
Figure 8b The oxygen-haemoglobin dissociation curve, haemoglobin concentration (150 g/L) « Previous Next » Show Labels « Back to contents list Print